Now that part I of the book is out, I’ve been using the #next-steps channel in the Agendashift Slack both to share plans for part II and to discuss enhancements to the online tools. I’ll blog about part II soon; this post is about a new feature that addresses a quite frequently-expressed need.
The basic need is the ability to analyse survey results in finer detail, reporting on different sub-populations – managers and staff, different teams, different roles, different projects, and so on.
There is already a crude way to achieve this, conducte multiple surveys and aggregate the results afterwards. It has two drawbacks however:
- The UI is very crude (it involves URL hacking)
- It works only if the populations are surveyed separately. That’s not always possible, it requires forethought, and it adds significant administrative overhead
Point 1 is of course fixable, but point 2 may not be. A different kind of solution is required.
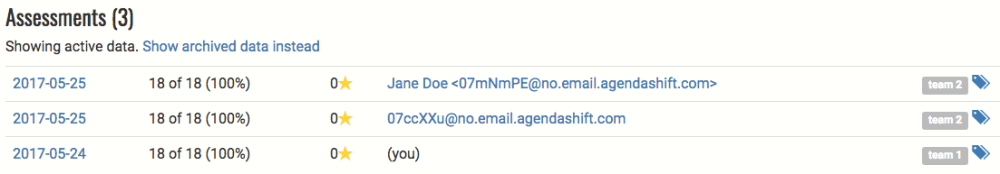
Now, survey administrators and participants may ‘tag’ their assessments, as many tags as they like:
And in the charts view, assessments may be included or excluded by tag:

You could, for example, include all assessments tagged for a given department, but exclude assessments tagged for certain roles.
Finally, if you’re curious about the context name ‘Free trial’, it’s one way to experiment with the mini version of the Agendashift values-based delivery assessment for free. You can sign up here.

Blog: Monthly roundups | Classic posts
Links: Home | Partner programme | Resources | Contact | Mike
Community: Slack | LinkedIn group | Twitter
